

Basics of Supply and Demand
Anyone who has taken a survey econ course has seen diagrams like the one above, commonly called a supply and demand diagram or supply and demand curves.
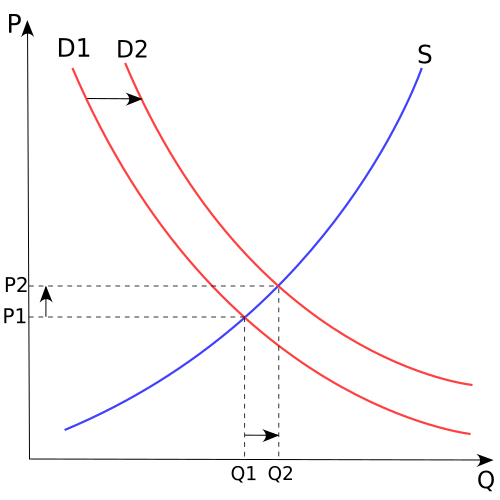
The horizontal axis (Q) is Quantity supplied of a product. Q2 is a larger quantity (greater supply) than Q1. The vertical axis (P) is Price to purchase the product. P2 is a larger price than P1.
The blue line labeled S is a supply curve for our product. As with most supply curves, it increases monotonically and tells us that, as the price P rises, the quantity Q of the product supplied also rises. This makes intuitive sense: if someone will pay a lot more for a hamburger, more people go into business selling hamburgers and the supply increases.
The red line labeled D1 is a demand curve for our product. As with most demand curves, it decreases monotonically and tells us that, as the price P falls, the quantity Q of the product demanded rises. This also makes intuitive sense: if the price of hamburgers drops, more people buy them.
These are typical supply and demand curves. There are others. These are representative supply and demand curves, they do not represent any specific product and market. It is possible (given the right sort of data) to generate actual supply and demand curves for actual products.
The point where S crosses D1 is a market equilibrium, where the supply of and demand for our product are equal. At this point, the market price is P1 and the quantity supplied is Q1. Equilibrium indicates that the price and supply will stay there once they are there. If the price is below the equilibrium, less of the product will be supplied (a shortage) and the price will be bid up. The higher price will encourage entry of other suppliers (or current suppliers will increase production if possible), the quantity supplied will increase and the price will drop toward the equilibrium.
The red curve labeled D2 is an alternate demand curve. Suppose that our product is made available to a new market: at any given price, more people want to buy our product, and the demand curve is shifted right, representing an increase in demand. With this increase in demand comes a new equilibrium, where D2 crosses S. Notice that both the price and quantity produced have increased at this new equilibrium: price from P1 to P2 and quantity from Q1 to Q2.
Markets
"Free markets" are amazing things. Left to themselves, they establish price and production amounts magically, without human intervention. Or do they?
"Free" market sounds like something that is unfettered, unconstrained, unregulated, and well, unreal. Markets are unable to operate without certain preconditions: good governance, stable currencies, security, confidence, etc. Without security and stability, markets fail. Without contract enforcement mechanisms, markets fail. Without producer and consumer confidence, markets fail.
Free marketeers often complain about government regulation. Economists (and remember, there's a reason why economics is called "the dismal science") will use supply and demand curves to show you that almost any government intervention (taxation, price supports or caps, etc.) distorts the free market and generates inefficiencies. And according to the theory, they are correct. However, honest economists will also admit that there are good reasons for governments to regulate markets (pdf), reasons which may go beyond economics.
Market Failures
One of the biggest reasons for government to regulate markets is "market failure". We've just seen an enormous one in the US, the so-called "subprime meltdown". The Long-Term Capital Management fiasco of the late 1990s also comes to mind.
Market failures include things like:
- Monopoly: where a producer has market power
- Monopsony: where a consumer has market power
- Externalities: where a producer or consumer doesn't pay the "real" cost of a good
- Public Goods: where a producer can't be properly compensated for the real benefit of a good
- Asymmetric Information: where one side of a transaction lacks relevant information
McCain's Gas Tax Holiday Proposal
John McCain wants to suspend federal gasoline taxes for the three months of the summer holiday. Specifically:
McCain urged Congress to institute a "gas-tax holiday" by suspending the 18.4 cent federal gas tax and 24.4 cent diesel tax from Memorial Day to Labor Day. By some estimates, the government would lose about $10 billion in revenue. He also renewed his call for the United States to stop adding to the Strategic Petroleum Reserve and thus lessen to some extent the worldwide demand for oil.
Combined, he said, the two proposals would reduce gas prices, which would have a trickle-down effect, and "help to spread relief across the American economy."
What would such a "gas-tax holiday" actually do, economically, to supply and demand? Since economists aren't physicists, it's impossible to say for sure, but here are a couple of the more believable scenarios:
- Assuming we are currently at a market equilibrium (a questionable assumption, considering the constant change in gas prices), reducing the price of a gallon of gas by 18.4 cents to the consumer would increase demand for gas. Increased demand should increase supply, but the summertime supply of gasoline in the US is relatively fixed, so the supply cannot increase. As a result, the price will resume the starting equilibrium -- and the total value of the tax reduction will accrue to the oil companies.
- The tax reduction will be split between the producers and the consumers, as apparently happened in Illinois in 2000, when gas hit $2/gallon for the first time. In the case of a real reduction in price to consumers, demand for gas will rise, raising the price of gasoline, but not as much as in the first scenario. However, gasoline usage will also rise, increasing the US carbon footprint.
Realistically, the gas-tax holiday will have little effect upon the average American. The price of gas might go down, but if it does, the amount of gasoline used will go up, pushing prices back up and increasing the flow of carbon into the atmosphere.
Sounds like a losing proposition to me, on the merits.
But it does appear to be pretty good political theatre.
NOTE: Nothing in this post should be construed as an endorsement of any Democratic candidate for president. It is an article with facts and opinions about politics. I have not made up my mind, and GNB is not endorsing any candidate prior to there being a clear nominee.


|